4 Introduction
To do: 1. check attributions and get copy right permissions (if needed) from IPCC and AMS 2. make sure that the language is correct / make it concise 3. proof read
The learning objectives are to
- Learn about the broad scientific consensus on climate change
- Know some authoritative sources for further information
- Introduce a Climate Dashboard (without coding)
What we believe (but every one may not agree completely) is that
- Earth is getting hotter
- Ice sheets and glaciers are melting
- Sea levels are raising.

source: AP Photo/U.S. Coast Guard, Petty Officer 2nd Class Kyle Niemi, Public domain, via Wikimedia Commons.
As seawater warms, it expands, and that expansion accounted for ~50% of the global average sea-level rise during that period (IPCC 2021).
We believe these are scientific facts where there is an overwhelming consensus. In our limited understanding, where there may be different opinions may because:
- Is it part of a longer natural climate cycle (that may be natural over hundreds or thousands or tens of thousands of years)
- Are humans responsible for the change in climate?
We believe that humans are responsible for at least part of the climate change. For example, the increase in green house gases (GhG). We also feel that can’t wait for conclusive evidence that may take hundreds of years and by then it may be too late for humankind.
We believe that we can still reduce our climate footprint by taking some actions that may not be costly.
One example we are heartened by is the recent news that the Ozone layer is recovering.
AMS Climate Change Report, page S308 notes that “… Past emissions of manufactured chlorine-containing substances such as chlorofluorocarbons (CFCs) have caused substantial chemical depletion of stratospheric ozone (WMO 2022). The resulting ozone loss led to increases of ultraviolet (UV) radiation at Earth’s surface with adverse effects on human health and the environment (Barnes et al. 2019; EEAP 2023)…”
However, as the recent United Nations Environment Program UNEP highlights
The UN-backed Scientific Assessment Panel to the Montreal Protocol on Ozone Depleting Substances quadrennial assessment report, published every four years, confirms the phase out of nearly 99% of banned ozone-depleting substances. The Montreal Protocol has thus succeeded in safeguarding the ozone layer, leading to notable recovery of the ozone layer in the upper stratosphere and decreased human exposure to harmful ultraviolet (UV) rays from the sun.
If current policies remain in place, the ozone layer is expected to recover to 1980 values (before the appearance of the ozone hole) by around 2066 over the Antarctic, by 2045 over the Arctic and by 2040 for the rest of the world. Variations in the size of the Antarctic ozone hole, particularly between 2019 and 2021, were driven largely by meteorological conditions. Nevertheless, the Antarctic ozone hole has been slowly improving in area and depth since the year 2000.
Yes, there may be some uncertainty about what may happen 50 or 100 years or later. However, are there actions that we can take today that can make reduce some of the negative impact? We don’t know for sure doesn’t mean that we can be complacent today. What if it is too late by the time we accumulate enough evidence about the impact of climate change?
Yes, international cooperation is not easy and some countries may not meet the targets. However, we believe that individual actions matter. As more and more citizens and countries feel the effects of climate change induced natural disasters, there may be more pressure to take concrete action.
In this part, we would like to first create a climate dashboard that visualizes the state of climate as of this version of the book (July 2024).
Our climate dashboard will have the following components. We will cover each of them in a separate chapter.
The goals for this chapter is to:
- Introduce some climate related terms so that we can understand the climate dashboard.
- Discuss the reports from some credible and authoritative climate related organizations such as The Intergovernmental Panel on Climate Change (IPCC), American Meteorological Association (AMS) and others
- Understand the work flow to build a climate dashboard.
This chapter doesn’t have any code!
4.1 Some Essential Climate Concepts
Climate affects everything! Our climate not only has an impact on the short-term weather and how we adjust our daily life activities. Even one inch of snowfall in Atlanta can lead to school closures! But climate has an important impact on how civilization evolves or whether it even survives. Imagine an earth that is 10 degrees Celsius hotter than it is now or ice covering parts of the U.S., similar to Antarctica!
Life as we know it if it continues to exist, would be different. But we are getting ahead. Before we delve in to the climate and climate change related issues, let us concretely define what we mean by Climate and Climate Change. It is always good to precisely define the terms that we are going to spend a lot of time learning. Otherwise, the same term may mean different things to different people and there may be confusion.
It is always a good idea to go to a credible source such as a government organization, international organization, scientific reports or associations as their discussion is backed by scientific evidence. One may not always agree with the methods or conclusions, but it is typically based on sound assumptions and is a reasonable starting point.
A great resource for all climate related information is the American Meteorological Association (AMS). AMS provides a nice Glossary that defines all the relevant climate related terms.
According to the AMS glossary,
Weather: The state of the atmosphere, mainly with respect to its effects upon life and human activities. As distinguished from climate, weather consists of the short-term (minutes to days) variations in the atmosphere Popularly, weather is thought of in terms of temperature, humidity, precipitation, cloudiness, visibility, and wind.
Climate The slowly varying aspects of the atmosphere–hydrosphere–land surface system. It is typically characterized in terms of suitable averages of the climate system over periods of a month or more, taking into consideration the variability in time of these averaged quantities. Climatic classifications include the spatial variation of these time-averaged variables. Beginning with the view of local climate as little more than the annual course of long-term averages of surface temperature and precipitation, the concept of climate has broadened and evolved in recent decades in response to the increased understanding of the underlying processes that determine climate and its variability.
Climate System is the physical, chemical, and biological processes are involved in the interactions among the components of the climate system.
So, in simple terms, weather is what we experience daily in a certain area at a certain time, say rain, temperature, snow etc., This is what we see and feel every day and what our weather on websites show. For example, when we were writing this chapter, The Weather Channel shows for Atlanta.
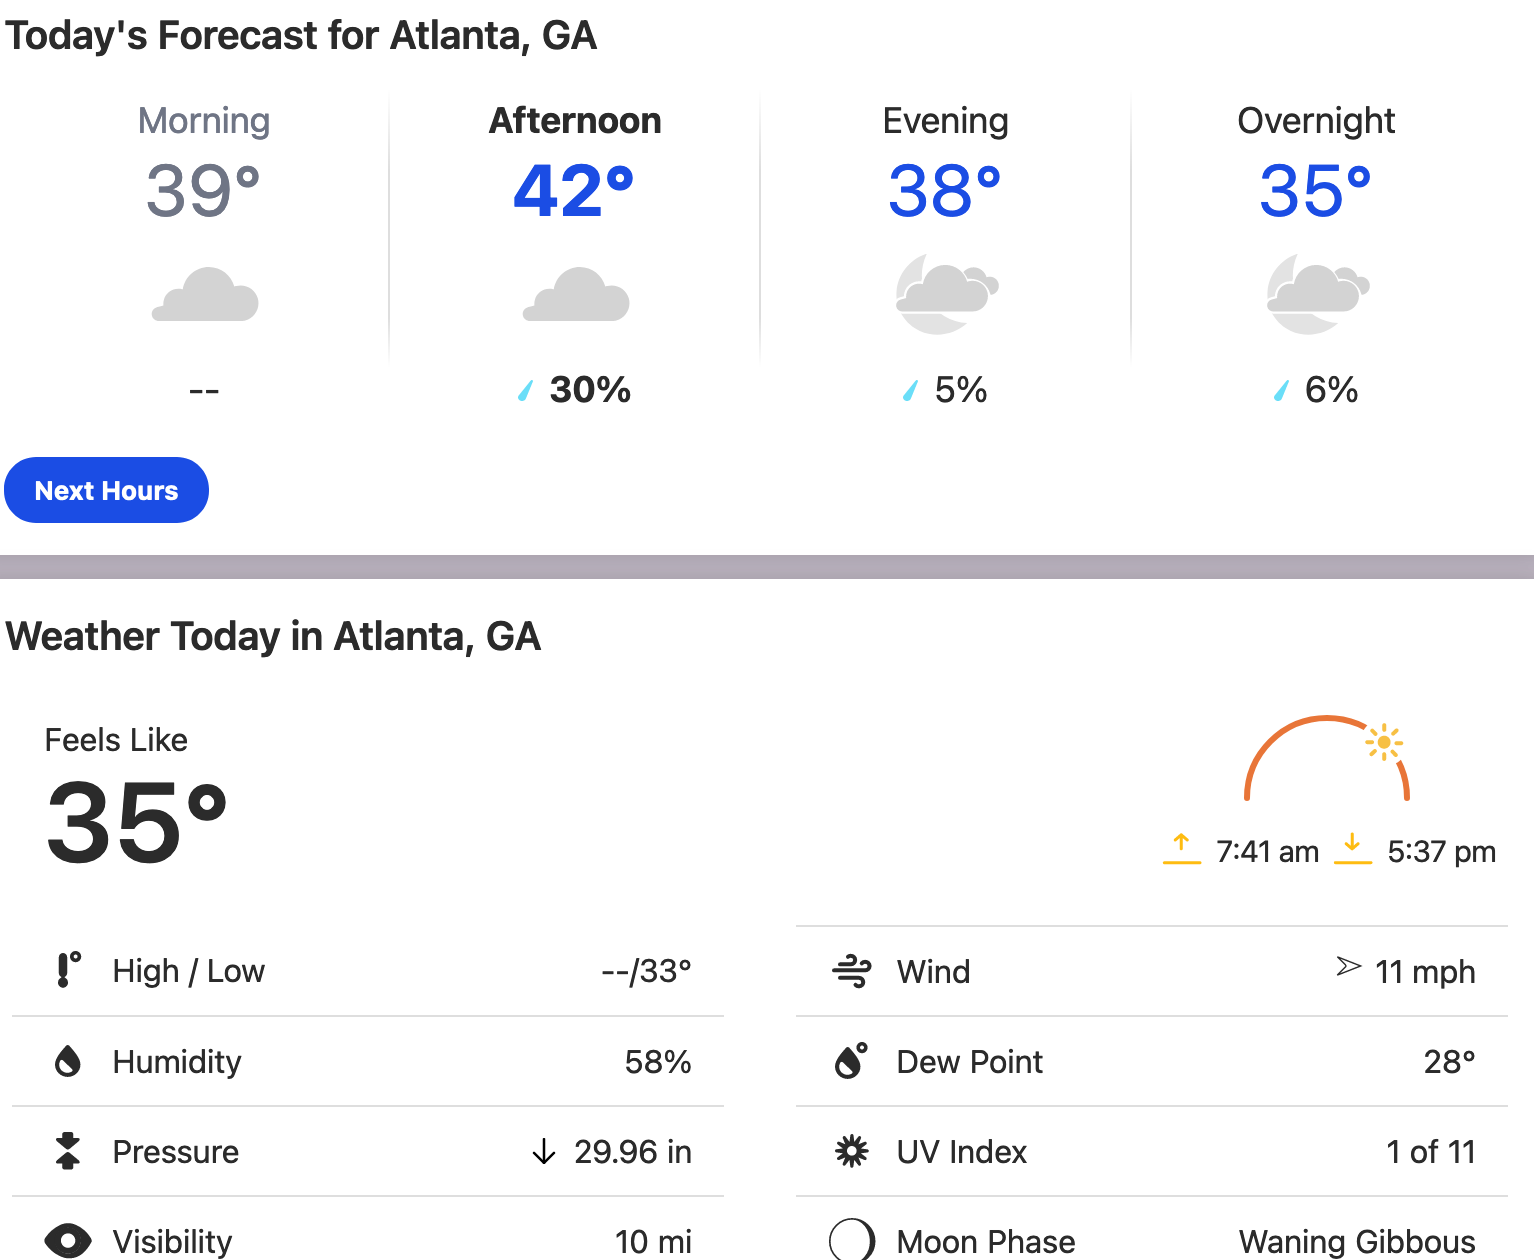
It’s cold! 🥶🥶🥶
From the AMS definitions, we can see that Climate and climate system are interconnected systems of global nature and more long-term phenomenon than really short-run, may be over decades or centuries.
How about climate change and the term that often accompanies it anthropogenic?
Climate change (Also called climatic change.) Any systematic change in the long-term statistics of climate elements (such as temperature, pressure, or winds) sustained over several decades or longer. Climate change may be due to natural external forcings, such as changes in solar emission or slow changes in the earth’s orbital elements; natural internal processes of the climate system; or anthropogenic forcing.
Anthropogenic Human-induced or resulting from human activities; often used to refer to environmental changes, global or local in scale.
Global Warming As defined by the Environmental Protection Agency (EPA), the recent and ongoing global average increase in temperature near the Earth’s surface.
There are many other climate related terms that are explained at
We will dig deeper into each of the individual climate indicators in the latter chapters in this book.
4.2 Status of Climate: The View from Scientific Experts
In this chapter, without getting into any data or code, let us see the consensus from authoritative sources on Climate about where we are in 2022/23. One of our learnings during this book writing journey is the amount of information and (mis)information that is available about the climate change topic. That’s why we wanted to start with scientific expert opinion. Let us start with IPCC
4.2.1 IPCC
The Intergovernmental Panel on Climate Change and it’s latest report AR6 Synthesis Report: Climate Change 2023 represents the scientific evidence accumulated till date and is a good starting point for us to understand what the experts’ judgement is.
What is IPCC? When are the assessment reports released?
Scientific evidence for warming of the climate system is unequivocal as highlighted by IPCC Report for 2022
4.2.2 Main Findings from the IPCC report on Current Climate
We will briefly list our understanding of some of the findings of the IPCC about the climate change here. We will discuss a few more in later chapters when we discuss the future climate scenarios and the likely impact. Here we focus on IPCC report on the status of the climate.
Global surface temperature was 1.09 [0.95 to 1.20]°C5 higher in 2011–2020 than 1850–1900, with larger increases over land (1.59 [1.34 to 1.83]°C) than over the ocean (0.88 [0.68 to 1.01]°C).
Global surface temperature has increased faster since 1970 than in any other 50-year period over at least the last 2000 years (high confidence)
Global mean sea level increased by 0.20 [0.15 to 0.25] m between 1901 and 2018. The average rate of sea level rise was 1.3 [0.6 to 2.1] mm yr between 1901 and 1971, increasing to 1.9 [0.8 to 2.9] mm yr between 1971 and 2006, and further increasing to 3.7 [3.2 to 4.2] mm yr between 2006 and 2018 (high confidence).
4.2.3 American Meteorological Society, State of Climate 2022
Another authoritative source is the AMS’s State of Climate Report.
In the abstract of the report, Blunden, Boyer and Bartow-Gillies (September 2023, page SIII) note that (our emphasis added)
Sea-surface temperature patterns in the tropical Pacific characteristic of La Niña and attendant atmospheric patterns tend to mitigate atmospheric heat gain at the global scale, but the annual global surface temperature across land and oceans was still among the six highest in records dating as far back as the mid-1800s. It was the warmest La Niña year on record.
Many areas observed record or near-record heat. Europe as a whole observed its second-warmest year on record, with sixteen individual countries observing record warmth at the national scale.
Records were shattered across the continent during the summer months as heatwaves plagued the region. On 18 July, 104 stations in France broke their all-time records. One day later, England recorded a temperature of 40°C for the first time ever.
China experienced its second-warmest year and warmest summer on record.
In the Southern Hemisphere, the average temperature across New Zealand reached a record high for the second year in a row. While Australia’s annual temperature was slightly below the 1991–2020 average, Onslow Airport in Western Australia reached 50.7°C on 13 January, equaling Australia’s highest temperature on record.
The effects of rising temperatures and extreme heat were apparent across the Northern Hemisphere, where snow-cover extent by June 2022 was the third smallest in the 56-year record, More frequent and intense heat- waves contributed to the second-greatest average mass balance loss for Alpine glaciers around the world since the start of the record in 1970.
In the high northern latitudes, the annual surface-air temperature across the Arctic was the fifth highest in the 123-year record. The seasonal Arctic minimum sea-ice extent, typically reached in September, was the 11th-smallest in the 43-year record; …Since 2012, the Arctic has been nearly devoid of ice more than four years old.
Across the world’s oceans, global mean sea level was record high for the 11th consecutive year, reaching 101.2 mm above the 1993 average
Globally-averaged ocean heat content was also record high in 2022, while the global sea-surface temperature was the sixth highest on record, equal with 2018. Approximately 58% of the ocean surface experienced at least one marine heatwave in 2022.
4.2.4 The Fifth National (U.S.) Climate Assessment.
The Fifth National Climate Assessment is the US Government’s preeminent report on climate change impacts, risks, and responses. It is a congressionally mandated interagency effort that:
“… integrates, evaluates, and interprets the findings of the Program and discusses the scientific uncertainties associated with such findings; analyzes the effects of global change on the natural environment, agriculture, energy production and use, land and water resources, transportation, human health and welfare, human social systems, and biological diversity; and analyzes current trends in global change, both human-induced and natural, and projects major trends for the subsequent 25 to 100 years…”.
As such, it provides the scientific foundation to support informed decision-making across the United States.
The key message from the Fifth National Climate Assessment taken directly from the NCA website are:
- Climate Is Changing, and Scientists Understand Why
- It is unequivocal that human activities have increased atmospheric levels of carbon dioxide and other greenhouse gases. It is also unequivocal that global average temperature has risen in response. Observed warming over the continental United States and Alaska is higher than the global average.
- Long-term changes have been observed in many other aspects of the climate system . The Earth system is complex and interconnected, which means changes in faraway regions are to affect the United States .
- Extreme Events Are Becoming More Frequent and Severe.
- Observations show an increase in the severity, extent, and/or frequency of multiple types of extreme events.
- Heatwaves have become more common and severe in the West since the 1980s.
- Drought risk has been increasing in the Southwest over the past century, while at the same time rainfall has become more extreme in recent decades, especially east of the Rockies.
- Hurricanes have been intensifying more rapidly since the 1980s and causing heavier rainfall and higher storm surges.
- More frequent and larger wildfires have been burning in the West in the past few decades due to a combination of climate factors, societal changes, and policies.
- How Much the Climate Changes Depends on the Choices Made Now:
- The more the planet warms, the greater the impacts—and the greater the risk of unforeseen consequences.
- The impacts of climate change increase with warming, and warming is to continue if emissions of carbon dioxide do not reach net zero . Rapidly reducing emissions would limit future warming and the associated increases in many risks.
- While there are still uncertainties about how the planet will react to rapid warming and catastrophic future scenarios that cannot be ruled out, the future is largely in human hands.
Some of the indicators that to track environmental trends and understand key factors that influence the environment are listed in NCA’s Appendix 4.
4.2.5 NASA
The National Aeronautics and Space Administration (NASA) is an independent agency of the U.S. federal government responsible for the civil space program, aeronautics research, and space research.
NASA, through its data collection and research has a great overview of the state of the climate. From its unique vantage point in space, NASA collects critical long-term observations of our changing planet.
They call it the vital signs of climate and make the dashboard available at https://science.nasa.gov/climate-change/
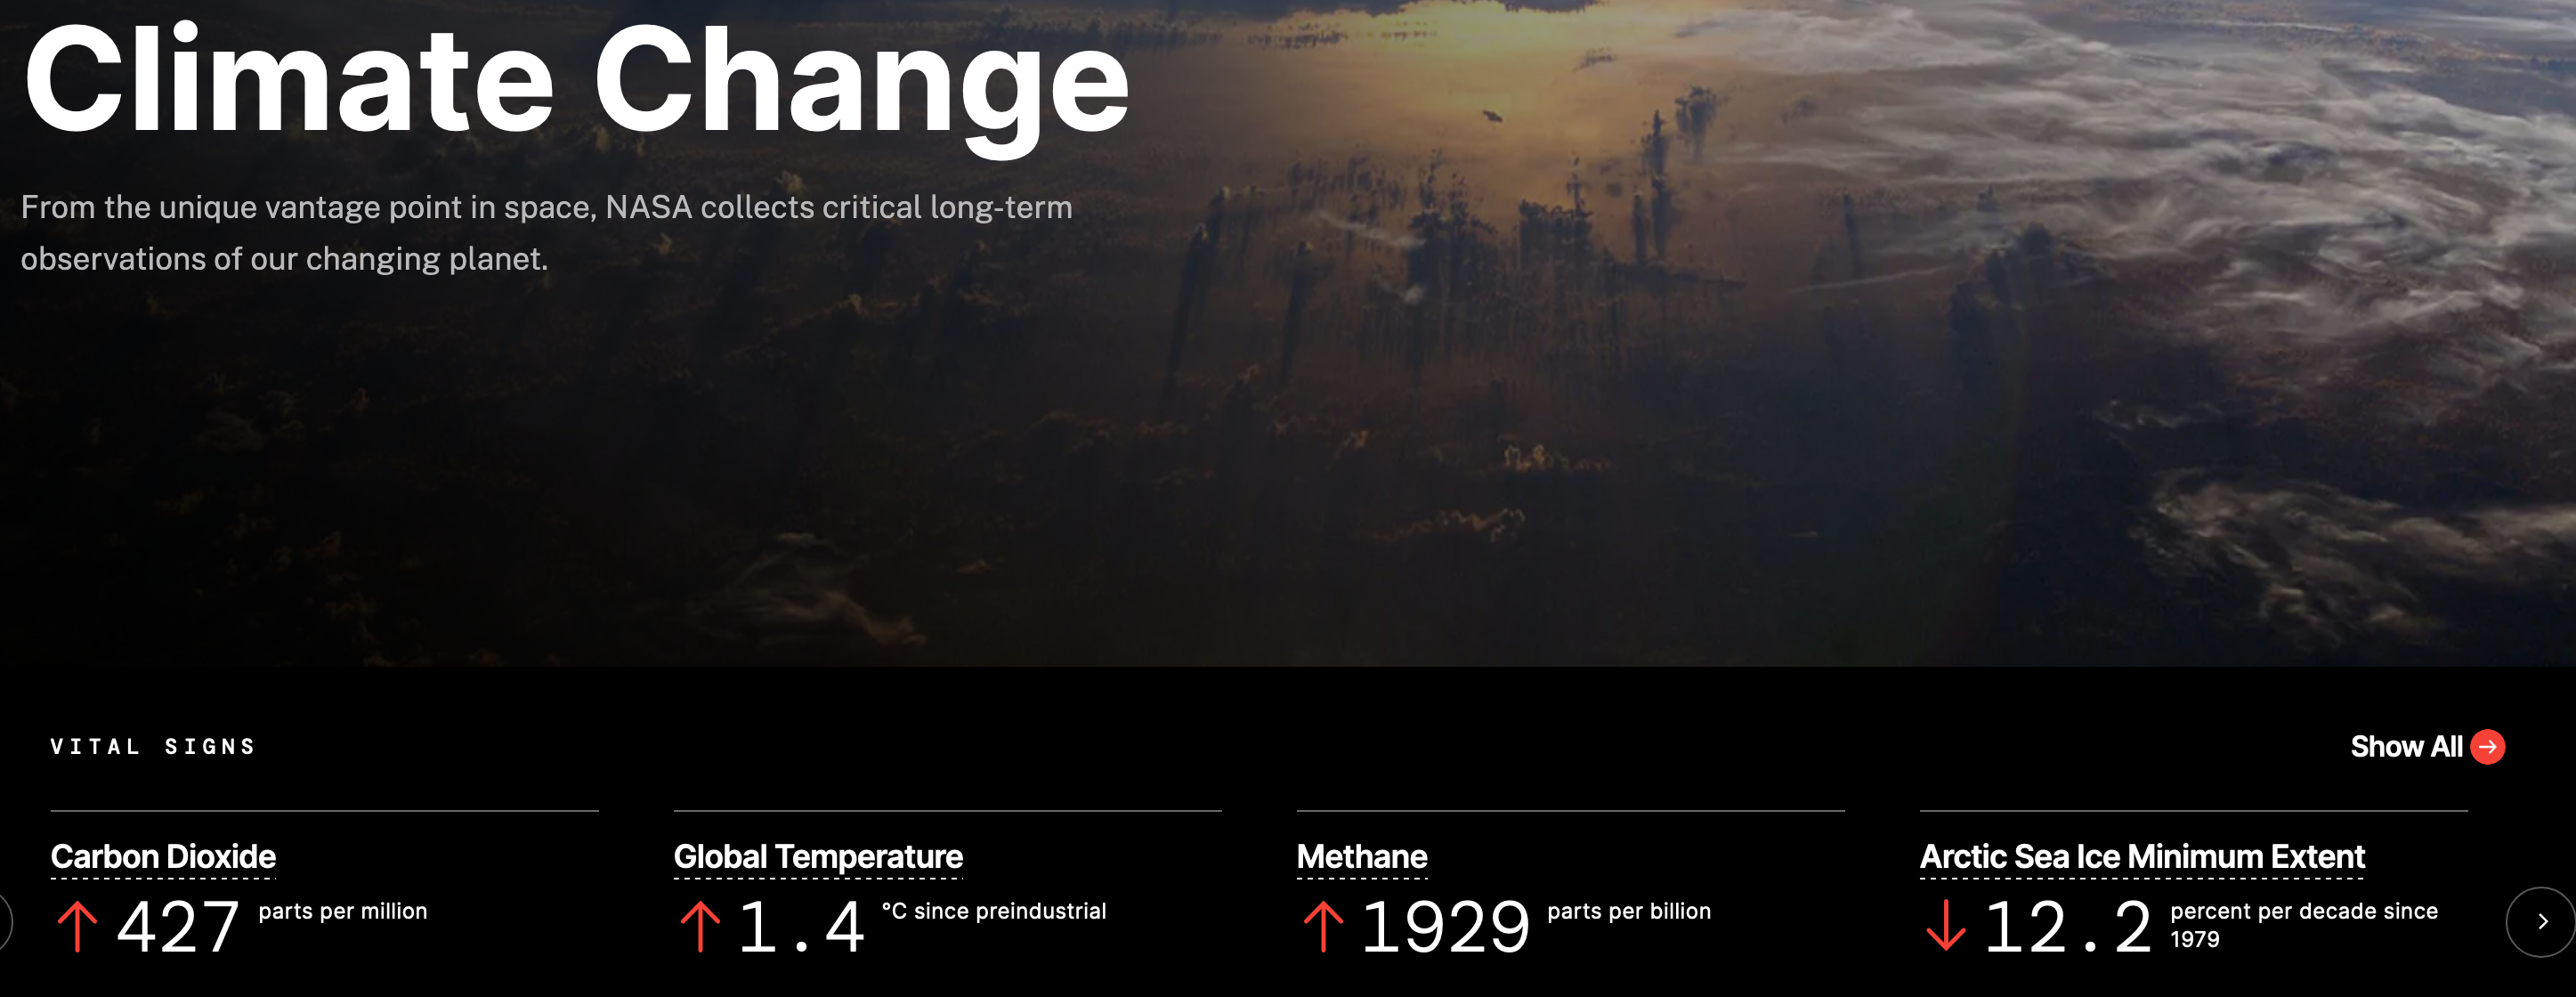
There are many data points and graphs that NASA presents on their website as evidence of climate change is real.
Some of the graphs are included below. Later we will dig into some of the data used in these reports and try to visualize and understand some of the issues with our own code and data analysis.
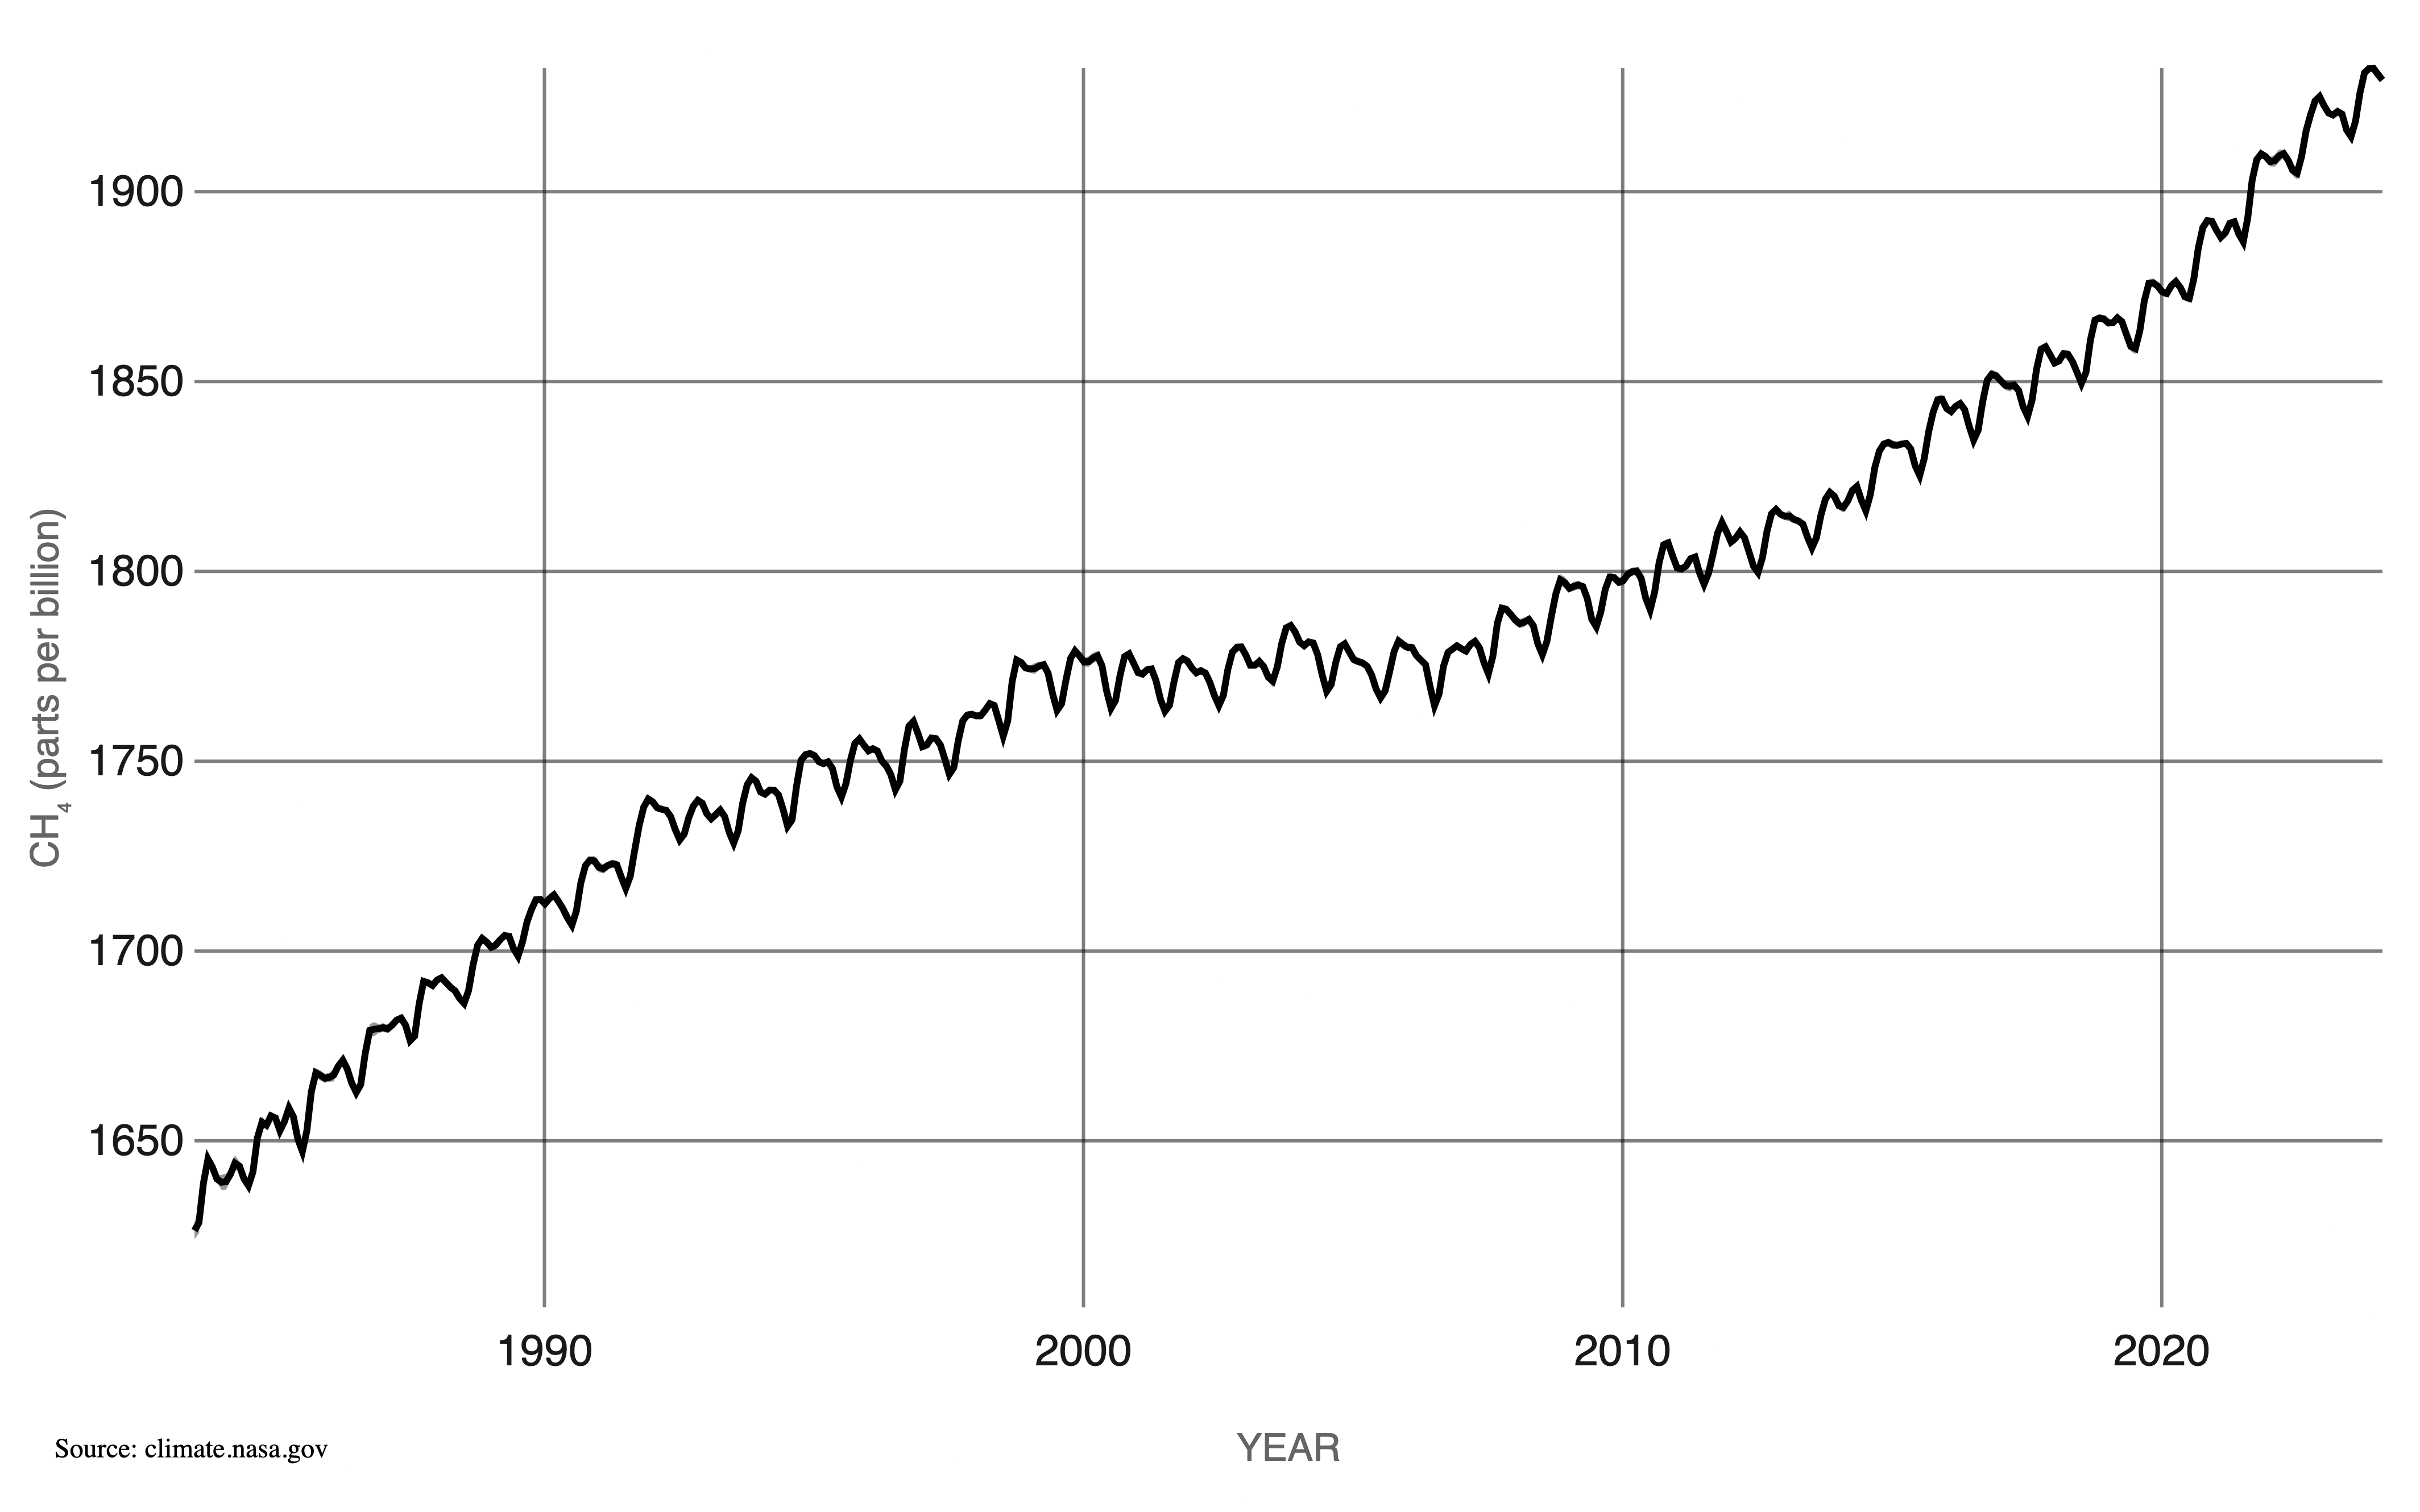
As we can see, there is a steep and uninterrupted increase in Methane emissions over the time the measurements are available from 1650 to now.
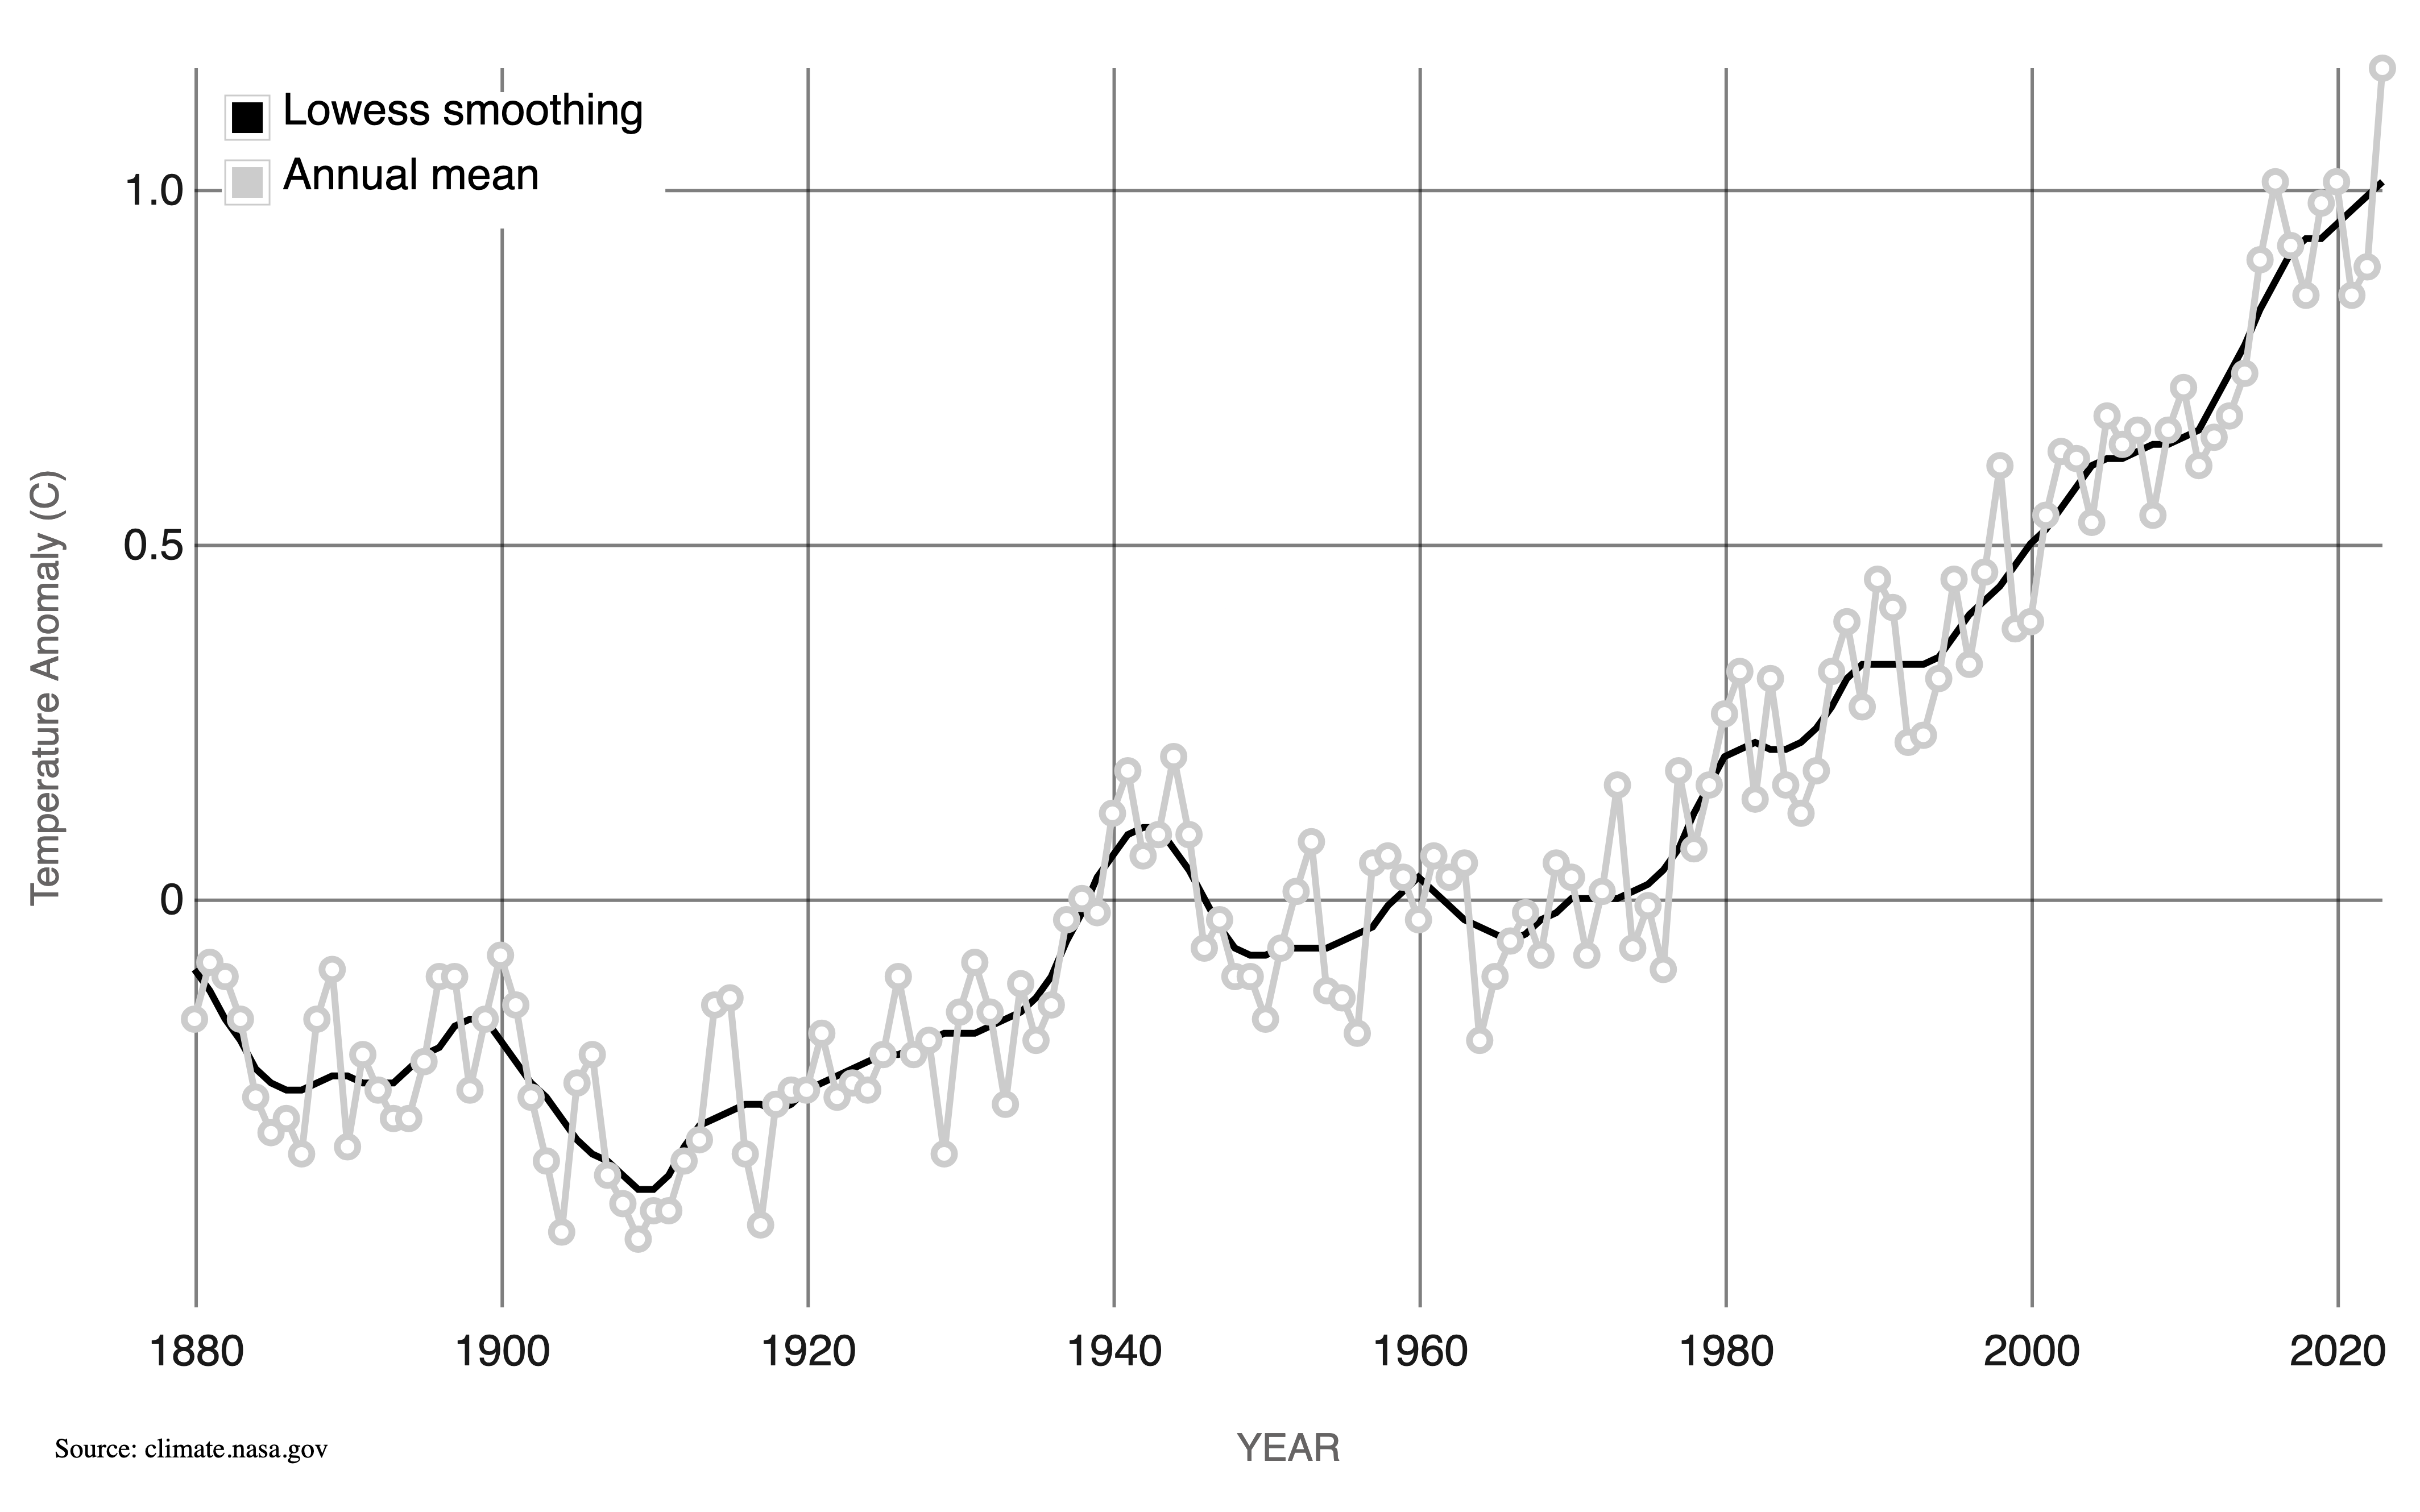
Similarly, the global temperatures seems to be increasing steeply over the last four decades.
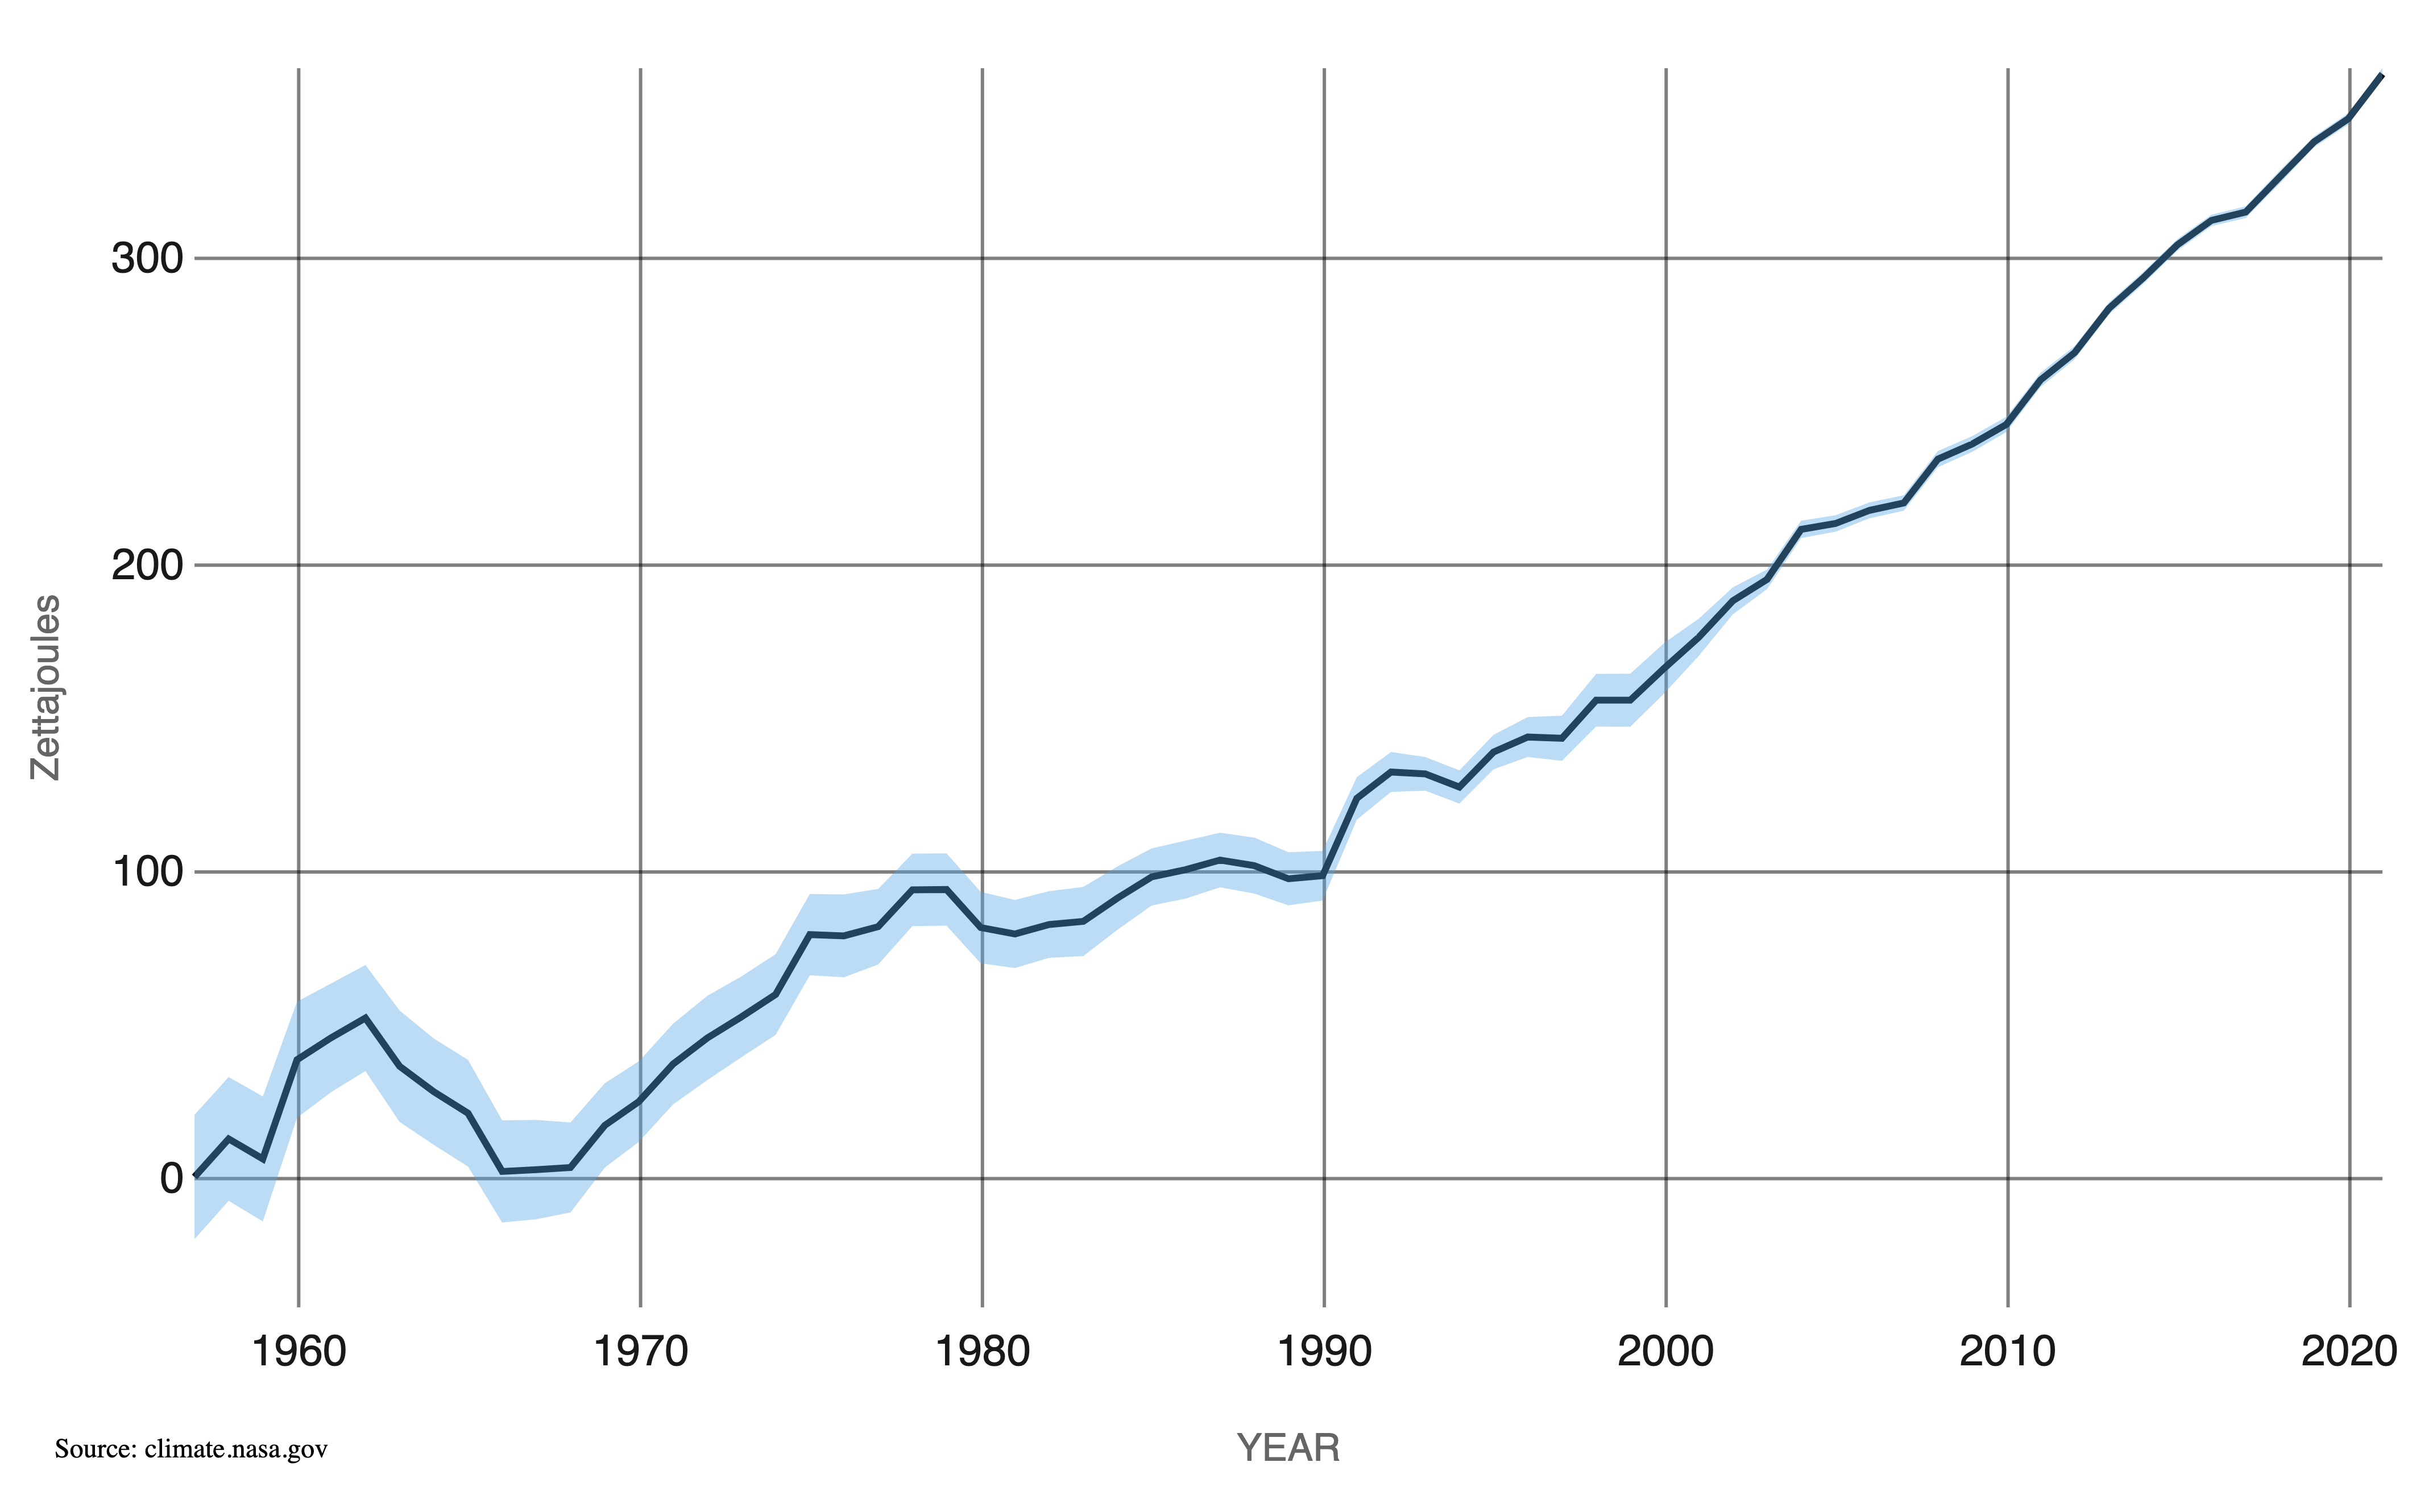
Oceans cover almost 71% of the earth’s surface. It is not surprising that most of the heat is absorbed by the Oceans and 90% of global warming is occurring in the ocean.
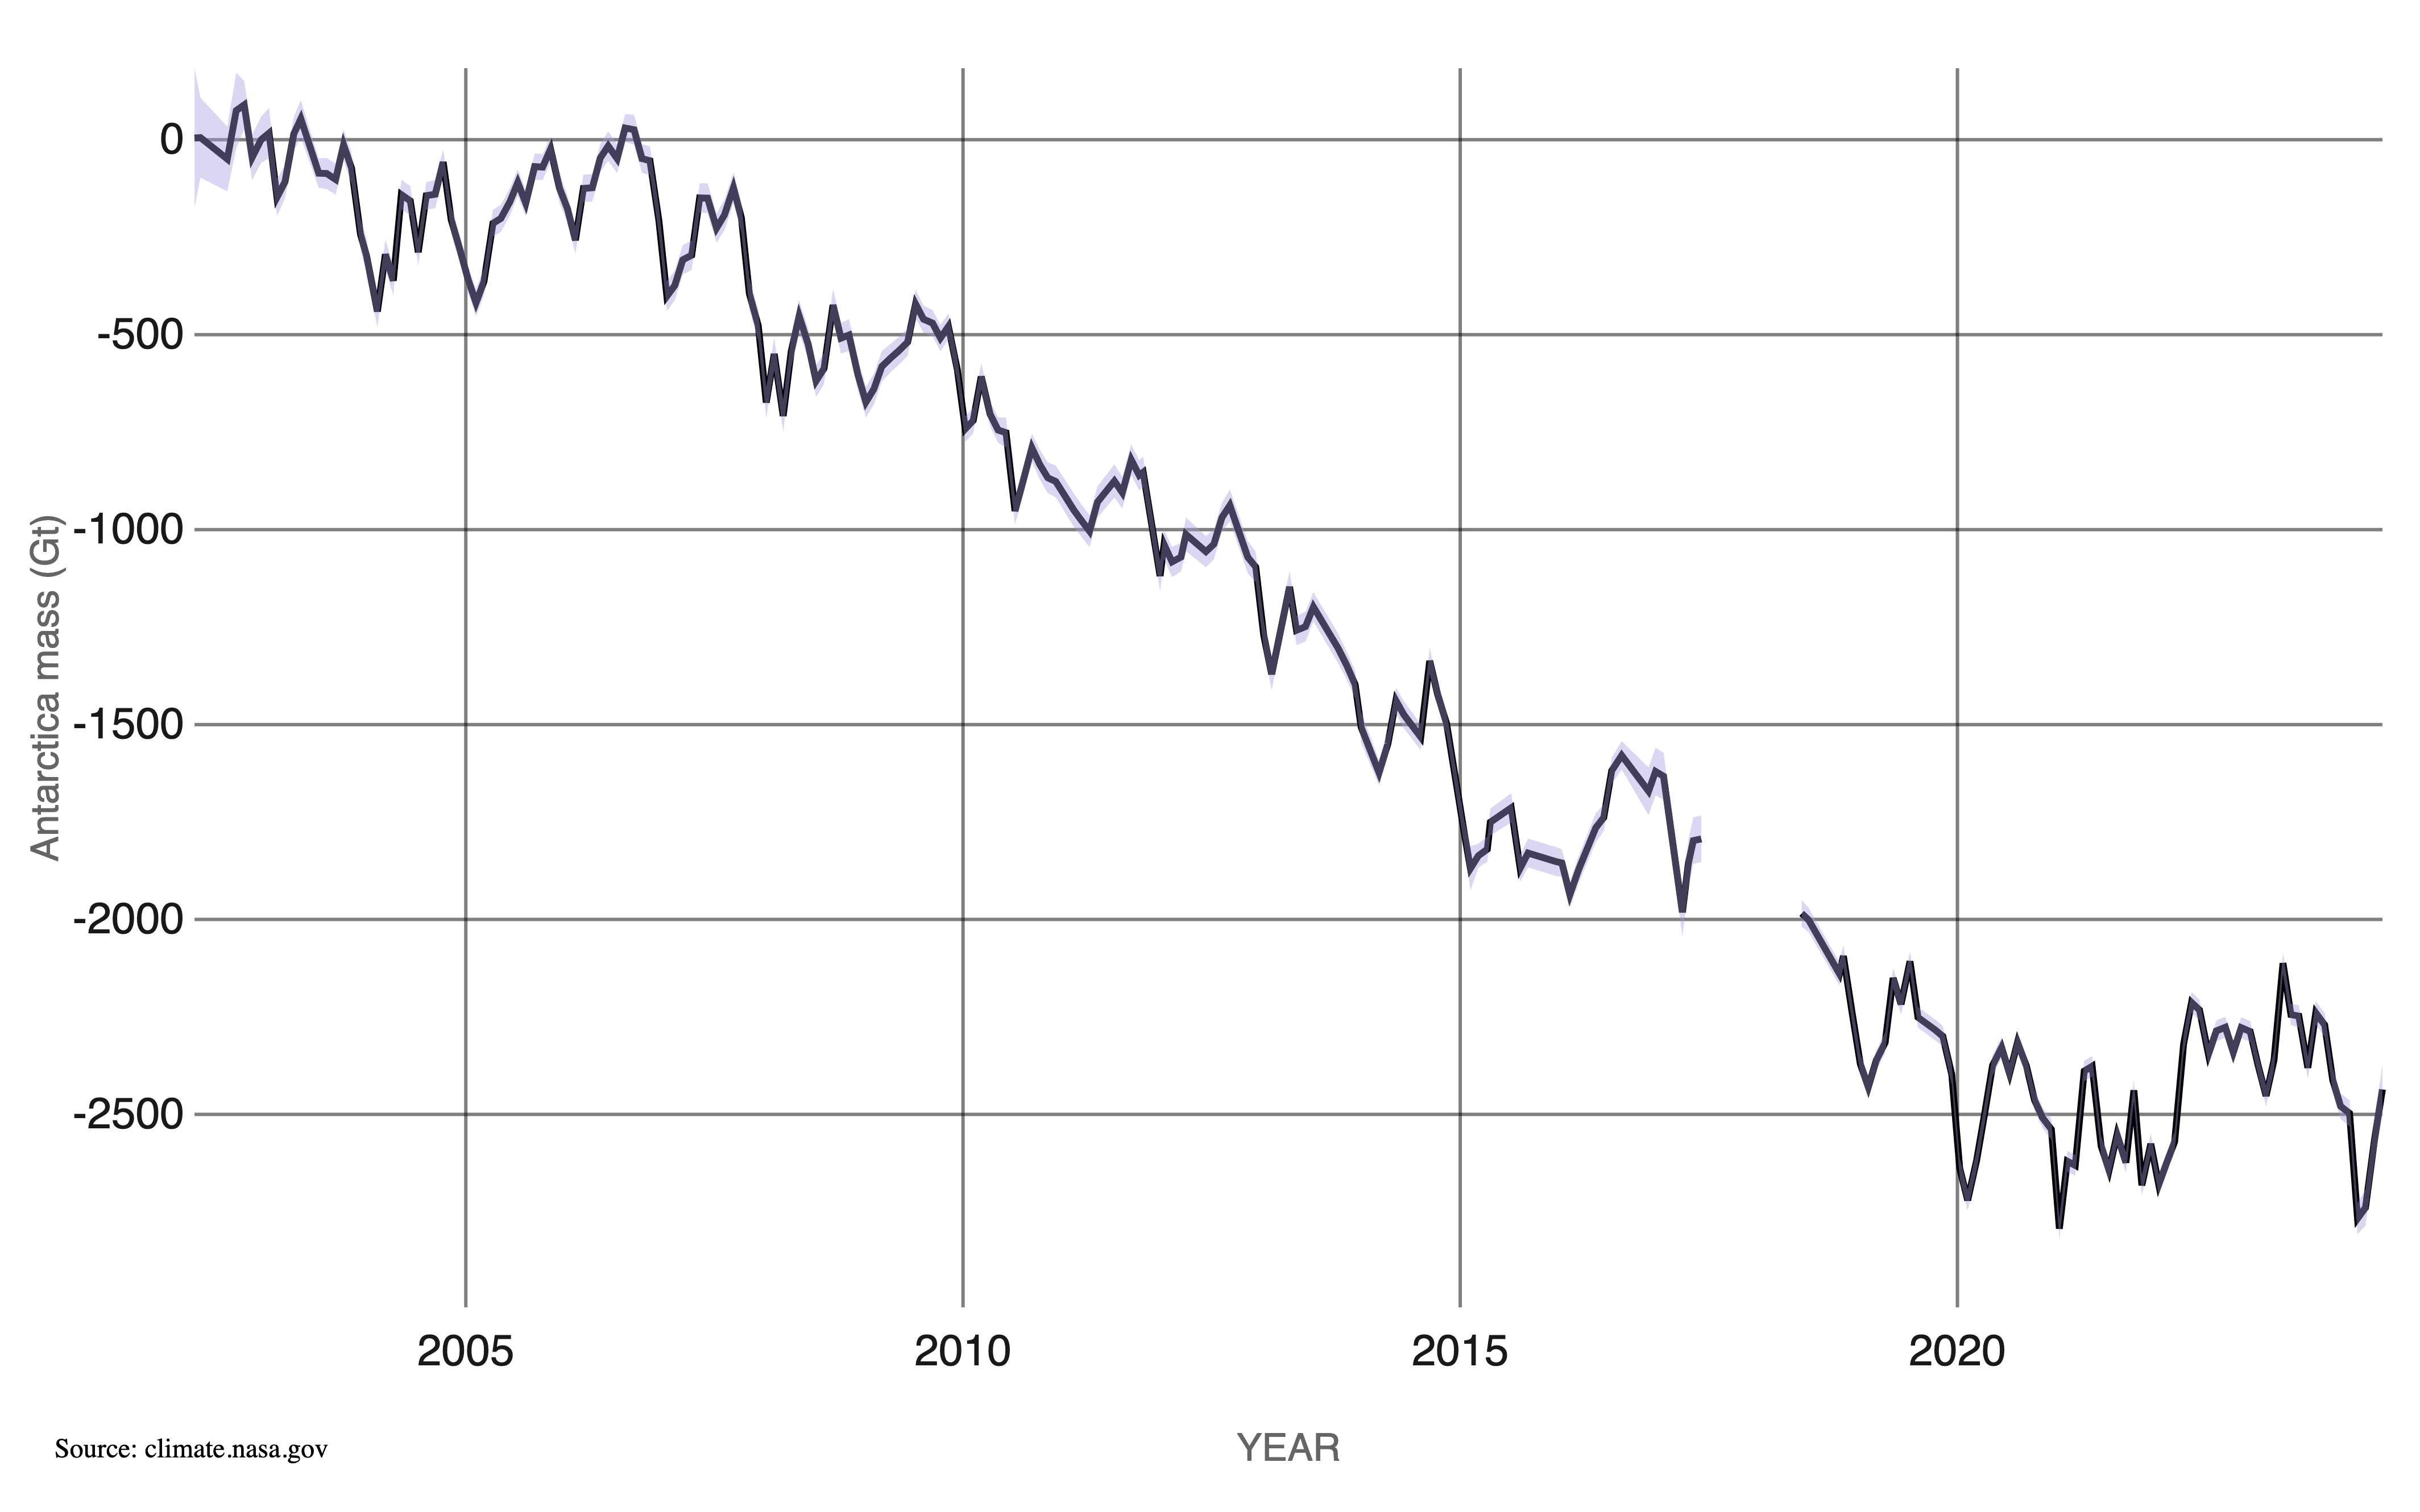
As the earth is getting warmer, we can see that there is a decrease in Antarctic land-ice mass
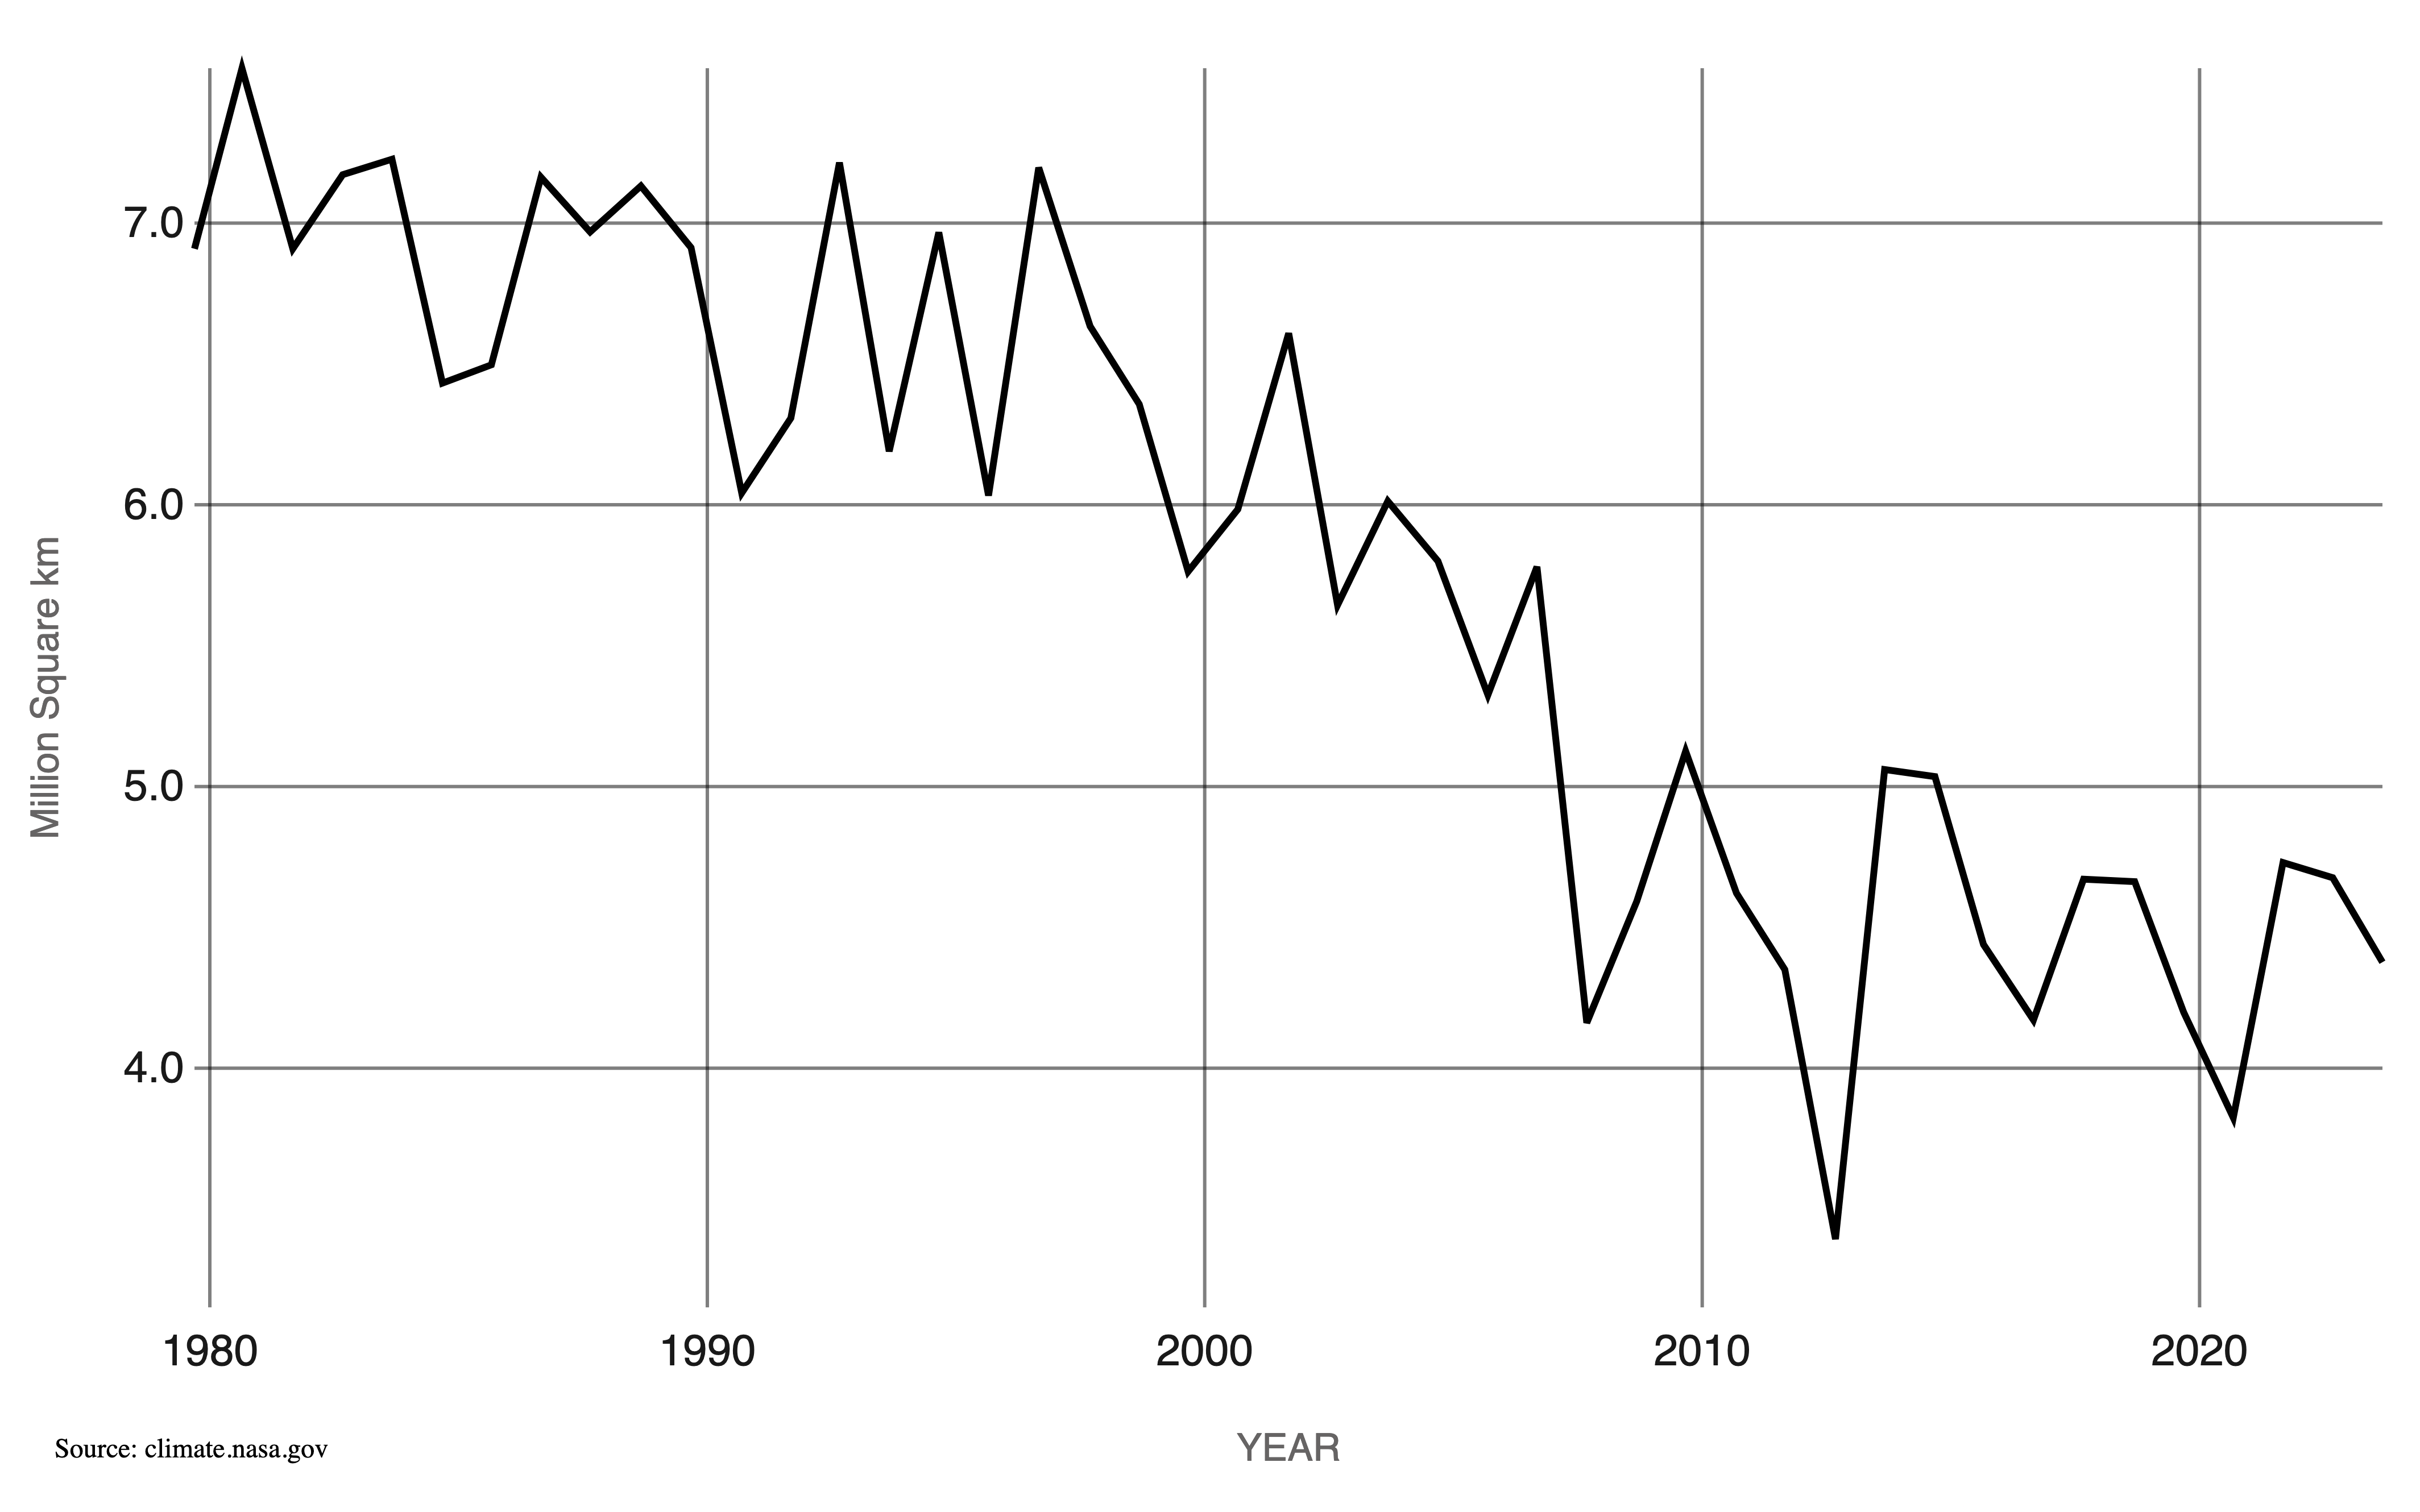
Similarly, there is a decrease in the Sea Ice also.
The main takeaways from NASA Climate Change, taken directly from their website are
- Carbon dioxide in the atmosphere warms the planet, causing climate change. Human activities have raised the atmosphere’s carbon dioxide content by 50% in less than 200 years.
- The 10 most recent years are the warmest years on record.
- Methane is a powerful heat-trapping gas. An estimated 60% of today’s methane emissions are the result of human activities.
- Summer Arctic sea ice extent is shrinking by 12.2% per decade due to warmer temperatures.
- Antarctica is losing ice mass (melting) at an average rate of about 150 billion tons per year, and Greenland is losing about 270 billion tons per year, adding to sea level rise.
- Global sea levels are rising as a result of human-caused global warming, with recent rates being unprecedented over the past 2,500-plus years.
- About ninety percent of global warming is occurring in the ocean.
In the later chapters in this book, we will try to recreate some of these graphs from the underlying data. This will give us a good understanding of the programming concepts and visualization techniques. In some ways, we are trying to reproduce and recreate some of these same graphs. We have decided to use some of the same data to reproduce these graphs as it would be easier to find our mistakes by looking at the original graphs. In addition, all these reports and websites have incredibly detailed information explaining the insights from the visualizations, much more than we can discuss in this book.
Our hope is that the readers learn the programming concepts, data wrangling and visualization tools, draw some insights and do further readings from IPCC and NCA and other reports.
4.3 Key Takeaways on the State of the Climate
The scientific consensus based on the data, reports, and analysis by U.S. government agencies such as NASA and EPA and other organizations such as IPCC and AMS is that climate change is real. We need to take action now to reduce the chances of further increase in global warming and climate change related effects.
2022 and the recent decades are some of the hottest years since mid 1800s
Both land and oceans are experiencing heat waves with many countries experiencing record-breaking heat waves.
Glaciers are melting
Sea levels are rising
Now that we have an overview of the main findings from some authoritative and comprehensive sources, let us dig deeper into the weeds and select some indicators where data is easily available. We can use our Python and visualization skills to plot and check the results ourselves.
In the next few chapters, we will
get publicly available data from EPA, NOAA and other sources that can help us understand the issues.
do data cleaning and required data manipulations.
learn how to use Plotly package to create some simple visualizations.
generate some similar insights as AMS, NASA, EPA and IPCC using this data.
We always start with the EPA data and dashboards as it will
- get data easily using the similar code
- it will allow us to benchmark our visualizations with EPA visualizations. This way, we can see if our code is working correctly and as intended
- we can rely on the explanations of EPA on the findings from the visualizations. There are many complicated concepts that we don’t always understand completely. Relying on the EPA data will allow us to fall back on their explanations as we know these have been vetted by scientists and other researchers with a deep knowledge of the subject.
By the way, if you see an error displayed in some chapters, it is not a coding error. We dynamically pull the data directly from the websites of the U.S. government agencies in many chapter. The National Center for Environmental Information (NCEI) that hosts the data that we use was hit by Hurricane Helene and the data center is down. It is ironical but highlights the reality of climate change and extreme weather.

References
Source: USGCRP, 2023: Fifth National Climate Assessment. Crimmins, A.R., C.W. Avery, D.R. Easterling, K.E. Kunkel, B.C. Stewart, and T.K. Maycock, Eds. U.S. Global Change Research Program, Washington, DC, USA. https://doi.org/10.7930/NCA5.2023